I’m a little more on the case this month (hurrah!) so here’s how our students did in their French tests in November (if you want to compare you can see October 2013’s French test stats and September 2013’s french test stats).
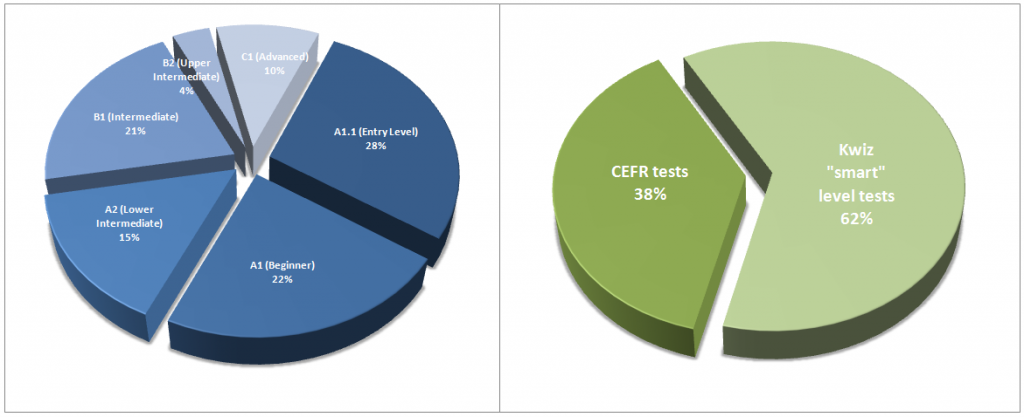
We graded another 111 CEFR French levels, and 183 smart French tests were taken.
French Tests taken by type (CEFR and Kwiz “smart” tests)

Left, CEFR tests by level awarded; Right, CEFR French placements tests taken versus Kwizzes taken (our smart French tests).
Do you know your French level? If not find out by taking our French CEFR test.
There was a slight change in French CEFR level compared last month, but we’re still seeing a larger number of beginners and advanced compared to level B2 especially. I wonder if this represents the natural "hump" students experience when learning a language?
This Month’s Top Testers – Improvement Scores
| Rank | Test this month | New Ground Covered* | Relative Brain Gain** | |||
| 1 | 81 | 34.4% | 63.1% | |||
| 2 | 12 | 3.3% | 57.6% | |||
| 3 | 10 | 14.2% | 8.8% | |||
| 4 | 9 | 19.2% | 61.2% | |||
| 5 | 7 | 19.2% | 62.6% |
* NGC is percentage of new topics tested up to CEFR level B2.
** RBG is a measure of test-demonstrated knowledge in the new topics covered.
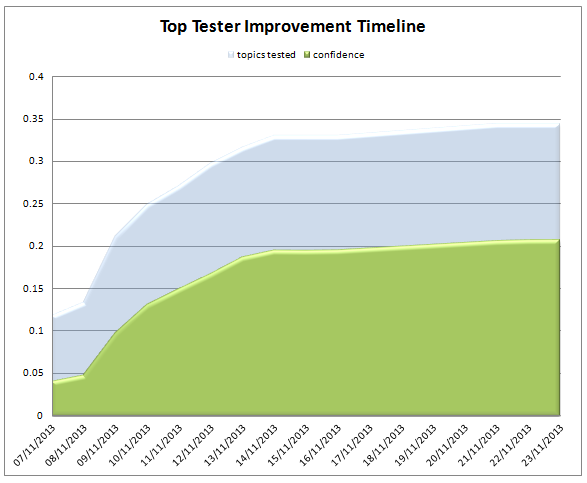
Our top French tester had an amazing month in November, taking an incredible 81 tests, covering a third of our topics and seeing a knowledge gain in those topics of 63%. Their improvement timeline is also very impressive:
November 2013 Top French Tester’s Improvement Timeline

This very impressive student continued to test consistently after their initial enthusiasm, and as a result saw a huge gain in confidence in their French grammar.
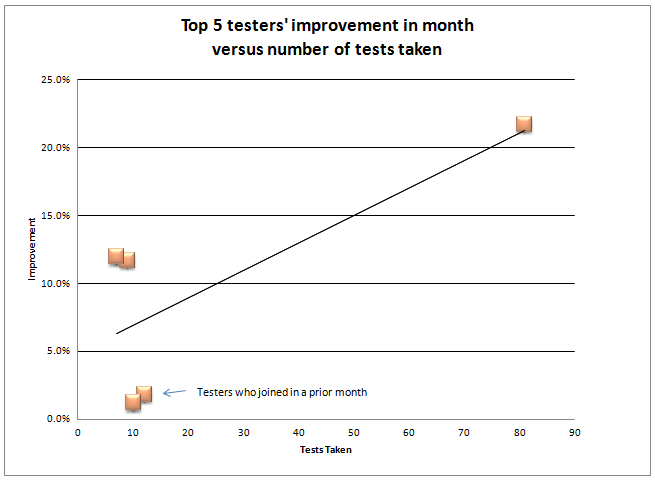
How does French testing relate to number of tests taken?

One of the low data points here is a tester from last month who once again made it into our top testers (but only just).
This graph needs a little extra explanation as it’s comparing apples with pears a little bit. I really ought to chart new testers seperately from testers who joined in a prior month as their stats are not easily compared. I’ll start doing that next month. When students first start taken French tests with our Kwiziq-powered system, there is always a large gain in apparent knowledge as the system determines what the student knows. Following this ramp, we normally see a more steady climb in knowledge with each new test. This means the gains decrease in the second month compared to the first, and you can see this clearly here in this chart. It may actually be clearer if I chart improvement over total tests over all time rather than in the month.
Nonetheless, all of our testers are once more proving that a test will you get an A!